Brazil and Argentina
CO2 from fossil fuels and industry produced in each country (territorial emissions; land-use change is not included), for 2022, the latest year with total, per-person and per-GDP figures for at least 150 countries. Ranks are among those 164 countries.
Argentina emitted 1.8 times as much CO2 per person as Brazil in 2022. Brazil emitted 2.6 times as much CO2 in total as Argentina.
| Measure | Brazil | Argentina |
|---|---|---|
| Totalmillion tonnes | 48012th of 164 | 18432nd of 164 |
| Per persontonnes | 2.2893rd of 164 | 4.0563rd of 164 |
| Per unit of GDPkg per international dollar (2011 prices, PPP) | 0.151116th of 164 | 0.21571st of 164 |
Per person over time
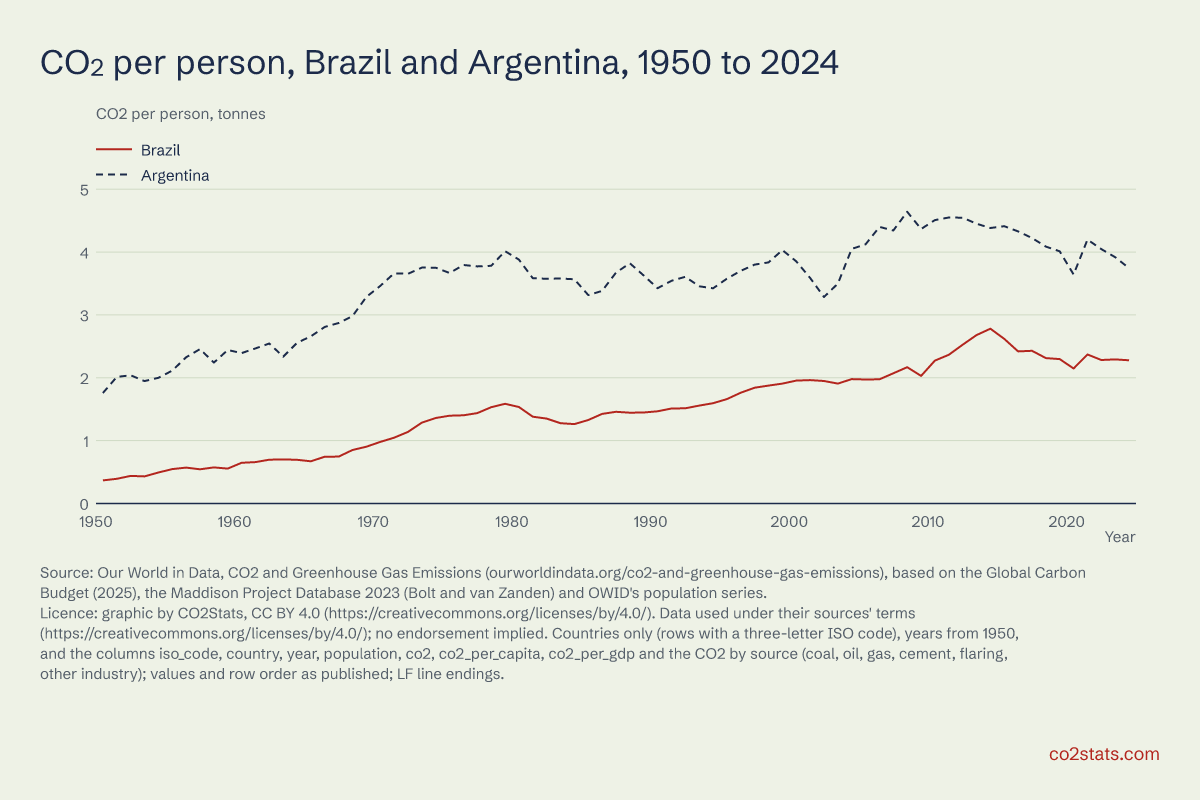
CO2 from fossil fuels and industry per person, 1950 to 2024. Brazil: 0.368 tonnes per person in 1950, 2.28 in 2024, with a high of 2.78 in 2014. Argentina: 1.76 tonnes per person in 1950, 3.74 in 2024, with a high of 4.64 in 2008.
Show the data as a table
| Year | Brazil, tonnes | Argentina, tonnes |
|---|---|---|
| 1950 | 0.368 | 1.76 |
| 1955 | 0.548 | 2.11 |
| 1960 | 0.647 | 2.39 |
| 1965 | 0.671 | 2.66 |
| 1970 | 0.98 | 3.46 |
| 1975 | 1.40 | 3.67 |
| 1980 | 1.54 | 3.88 |
| 1985 | 1.33 | 3.32 |
| 1990 | 1.47 | 3.42 |
| 1995 | 1.66 | 3.58 |
| 2000 | 1.95 | 3.85 |
| 2005 | 1.97 | 4.12 |
| 2010 | 2.27 | 4.51 |
| 2015 | 2.62 | 4.41 |
| 2020 | 2.15 | 3.64 |
| 2024 | 2.28 | 3.74 |
Sources and licences
- Our World in Data, CO2 and Greenhouse Gas Emissions (owid-co2-data.csv): countries from 1950. Our World in Data, CO2 and Greenhouse Gas Emissions (ourworldindata.org/co2-and-greenhouse-gas-emissions), based on the Global Carbon Budget (2025), the Maddison Project Database 2023 (Bolt and van Zanden) and OWID's population series. Retrieved 16 October 2026. CC BY 4.0 for Our World in Data's own work; data produced by third parties keeps its source's terms (OWID's co2-data README). CO2: Global Carbon Budget (2025); GDP: Maddison Project Database 2023; population: OWID's population series. Terms, full data file. Changes: Countries only (rows with a three-letter ISO code), years from 1950, and the columns iso_code, country, year, population, co2, co2_per_capita, co2_per_gdp and the CO2 by source (coal, oil, gas, cement, flaring, other industry); values and row order as published; LF line endings.
Our chart is licensed CC BY 4.0: share it with a credit and a link. The data keep their sources' terms, and no endorsement is implied.