Azerbaijan
CO2 from fossil fuels and industry in Azerbaijan, 2022.
2022 at a glance
- Total
- 41.2 million tonnes62nd of 164 countries in 2022
- Per person
- 4.00 tonnes64th of 164 countries in 2022
- Per unit of GDP
- 0.235 kg per international dollar (2011 prices, PPP)60th of 164 countries in 2022
In 2024, the latest year with a total, Azerbaijan emitted 39.8 million tonnes.
The trend
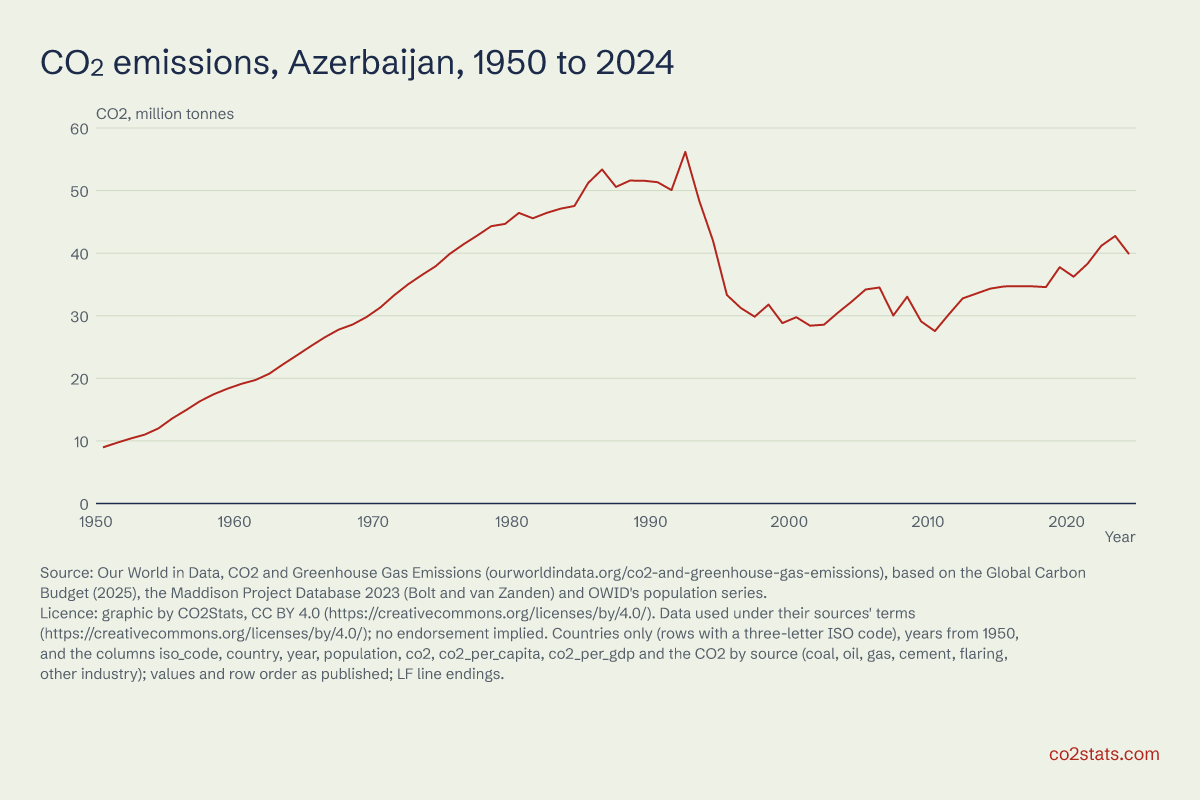
CO2 from fossil fuels and industry in Azerbaijan was 39.8 million tonnes in 2024, 22% less than in 1990. The highest yearly total between 1950 and 2024 was 56.2 million tonnes, in 1992.
Show the data as a table
| Year | Million tonnes |
|---|---|
| 1950 | 8.96 |
| 1955 | 13.6 |
| 1960 | 19.1 |
| 1965 | 25.1 |
| 1970 | 31.3 |
| 1975 | 39.9 |
| 1980 | 46.4 |
| 1985 | 51.2 |
| 1990 | 51.3 |
| 1995 | 33.3 |
| 2000 | 29.8 |
| 2005 | 34.2 |
| 2010 | 27.5 |
| 2015 | 34.7 |
| 2020 | 36.2 |
| 2024 | 39.8 |
By source, 2022
| Source | Million tonnes |
|---|---|
| Coal | 0.044 |
| Oil | 12.8 |
| Gas | 26.8 |
| Cement | 1.12 |
| Gas flaring | 0.371 |
Sources
- Our World in Data, CO2 and Greenhouse Gas Emissions (owid-co2-data.csv): countries from 1950. Our World in Data, CO2 and Greenhouse Gas Emissions (ourworldindata.org/co2-and-greenhouse-gas-emissions), based on the Global Carbon Budget (2025), the Maddison Project Database 2023 (Bolt and van Zanden) and OWID's population series. Retrieved 16 October 2026. Terms. Trimmed from the published file.
Share our chart with a credit and a link (CC BY 4.0).