Greenland
CO2 from fossil fuels and industry produced in Greenland (territorial emissions; land-use change is not included). The figures below are for 2022, the latest year with total, per-person and per-GDP figures for at least 150 countries.
2022 at a glance
- Total
- 0.587 million tonnes
- Per person
- 10.5 tonnes
- Per unit of GDP
- Not published
Not ranked: the snapshot has no per-GDP figure for Greenland in 2022, so it is outside the 164 countries compared.
In 2024, the latest year with a total, Greenland emitted 0.619 million tonnes.
The trend
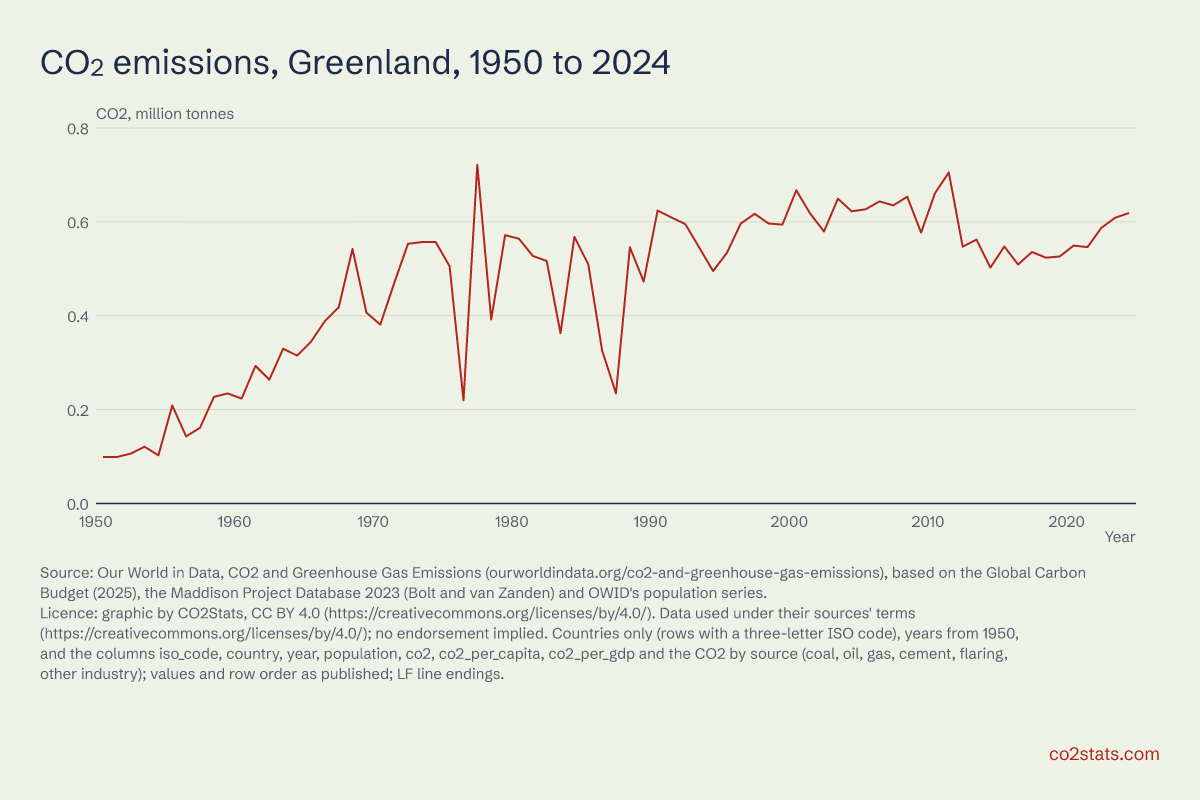
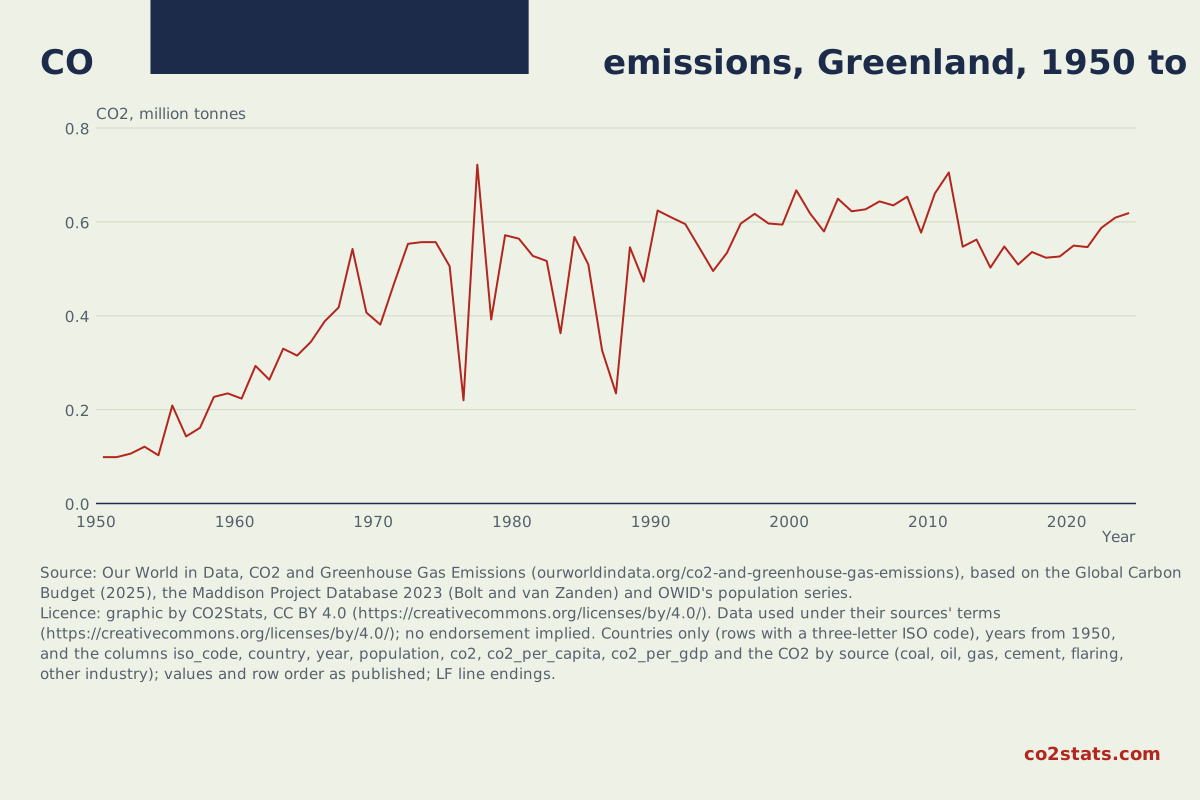
CO2 from fossil fuels and industry in Greenland was 0.619 million tonnes in 2024, 1% less than in 1990. The highest yearly total between 1950 and 2024 was 0.722 million tonnes, in 1977.
Show the data as a table
| Year | Million tonnes |
|---|---|
| 1950 | 0.0989 |
| 1955 | 0.209 |
| 1960 | 0.224 |
| 1965 | 0.344 |
| 1970 | 0.381 |
| 1975 | 0.506 |
| 1980 | 0.564 |
| 1985 | 0.509 |
| 1990 | 0.624 |
| 1995 | 0.534 |
| 2000 | 0.667 |
| 2005 | 0.627 |
| 2010 | 0.661 |
| 2015 | 0.548 |
| 2020 | 0.55 |
| 2024 | 0.619 |
By source, 2022
OWID splits CO2 by the fuel or process it comes from, not by economic sector. The published parts add up to 0.587 million tonnes of the 0.587 million tonne total.
| Source | Million tonnes |
|---|---|
| Oil | 0.587 |
| Cement | 0 |
| Gas flaring | 0 |
Sources and licences
- Our World in Data, CO2 and Greenhouse Gas Emissions (owid-co2-data.csv): countries from 1950. Our World in Data, CO2 and Greenhouse Gas Emissions (ourworldindata.org/co2-and-greenhouse-gas-emissions), based on the Global Carbon Budget (2025), the Maddison Project Database 2023 (Bolt and van Zanden) and OWID's population series. Retrieved 16 October 2026. CC BY 4.0 for Our World in Data's own work; data produced by third parties keeps its source's terms (OWID's co2-data README). CO2: Global Carbon Budget (2025); GDP: Maddison Project Database 2023; population: OWID's population series. Terms, full data file. Changes: Countries only (rows with a three-letter ISO code), years from 1950, and the columns iso_code, country, year, population, co2, co2_per_capita, co2_per_gdp and the CO2 by source (coal, oil, gas, cement, flaring, other industry); values and row order as published; LF line endings.
Our chart is licensed CC BY 4.0: share it with a credit and a link. The data keep their sources' terms, and no endorsement is implied.